Distortion
The distortions were measured using the Amber 5500 instrument (THD+N) and the HP3562A spectrum analyzer (THD and IMD by CCIF and SMPTE methods). HP3562A has a dynamic range of only 86dB, so it was either fed with the signal after the fundamental was rejected by the Amber 5500 notch filter or the measurements were done in a frequency range that excludes the fundamental. The signal chain was separately carefully calibrated by measuring the gain/attenuation of the amp itself and the signal path in the Amber 5500 instrument. Using the advanced math functions in the HP3562A the spectra (reference and output) were normalized and substracted. All distortion results below are in dBVrms referenced to the amp output.
Using this method, the dynamic range of our test equipment was extended well beyond the original limits; some pictures below show noise floors around 160dB. This is of course the effect of spectra substraction rather than a measured value.
The Amber 5500 residual spectra at 20KHz is shown in the following photo.
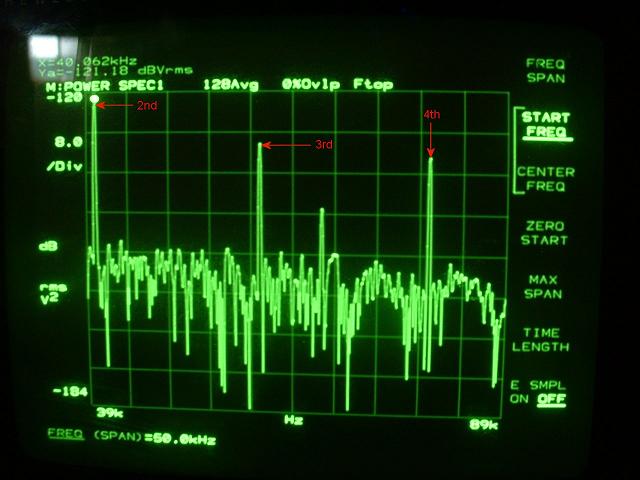
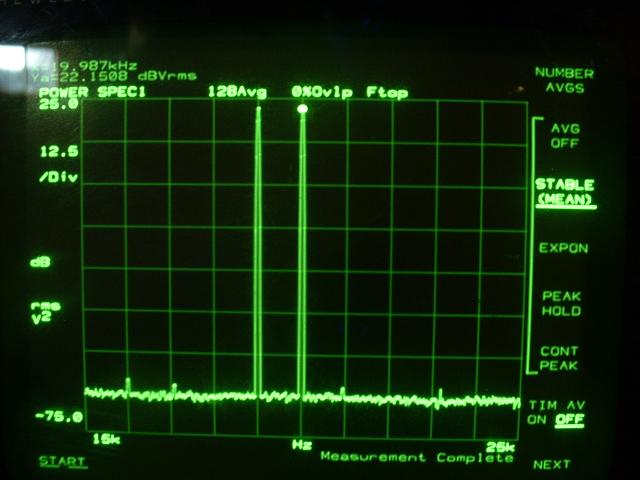
The output spectra at 20KHz is shown in the next picture. After normalizing the signals and substracting the Amber 5500 sine wave oscillator residuals, the distortions are confirmed as being mostly related to the 2nd harmonic. The THD is under 0.0001%, or 1ppm. As it will be confirmed below, we reached or design and implementation target
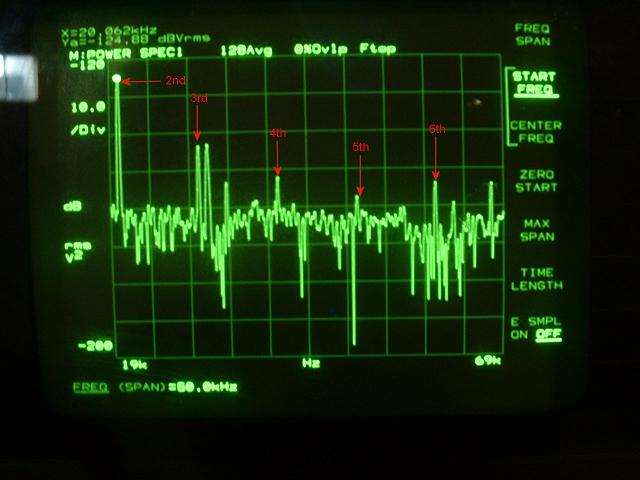
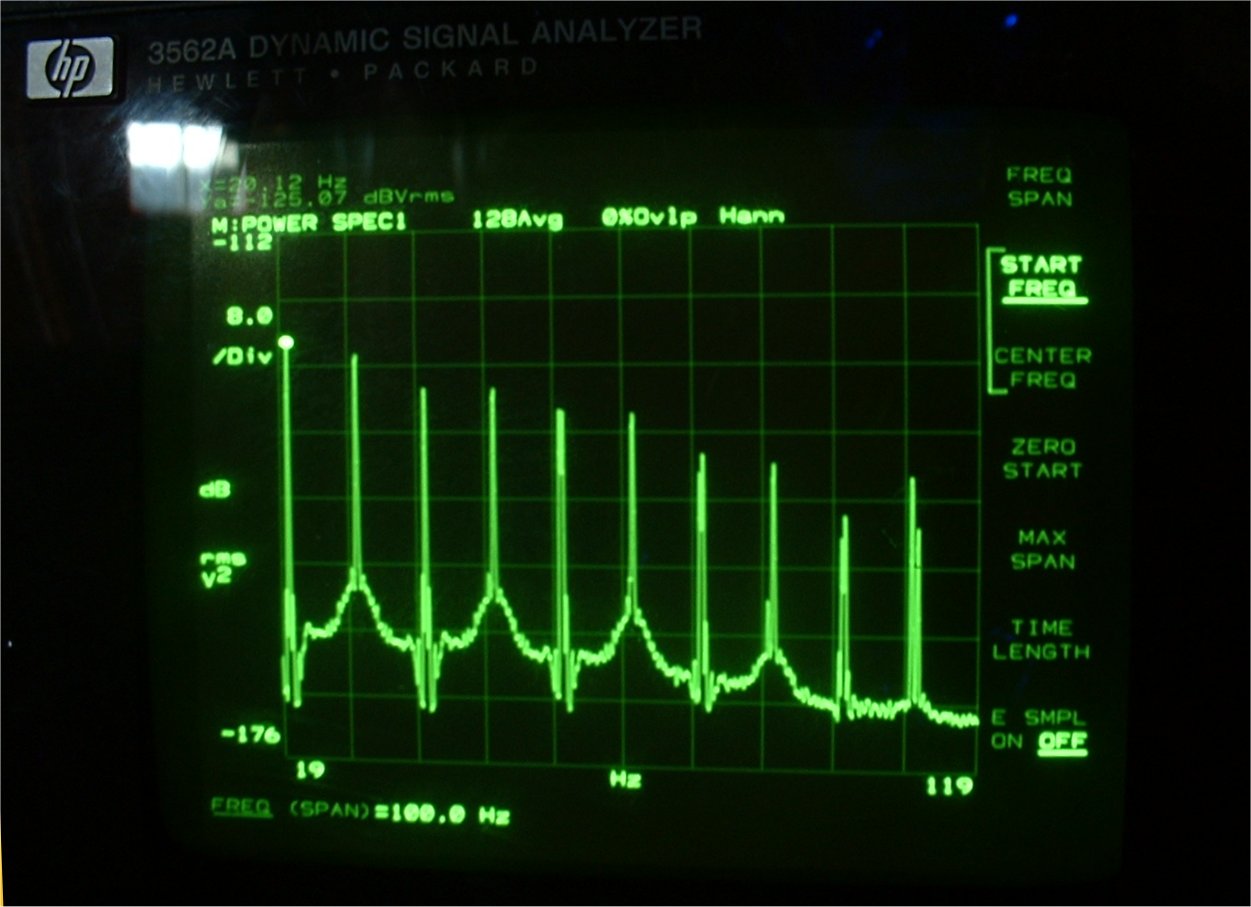
In order to investigate the higher harmonics, we had to lower the input signal frequency to 10KHz (the 3562A analyzer has an upper frequency limit of 100KHz and a real time frequency span of 50KHz). The results are shown below, up to the 6th harmonic. A separate experiment at 5KHz shows that the 7th and upper harmonics levels are under the capability of our measuring equipment and setup.
Finally, we did a measurement at a low output level of 1V. Unfortunately we were unable to go even lower, since we reached the noise floor of our instruments and measurement setup. The THD is at 1W slightly over 1ppm, however the measurements are pretty inconsisten here, due to the noise. More work is required here to improve the measuring techniques.
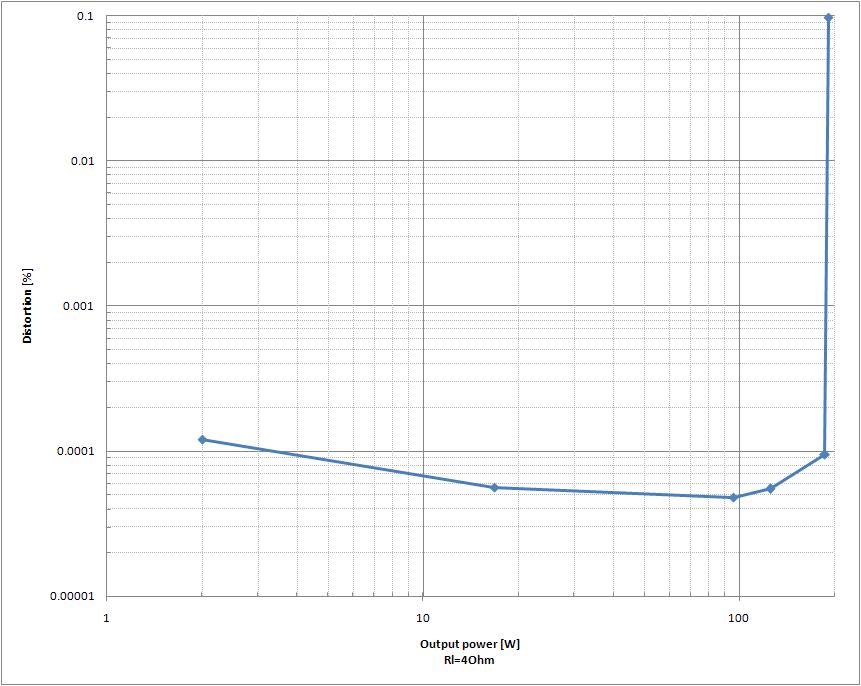
After averaging the above measurement at 1W several times (it got better) and measuring at several other output levels we go the THD vs. output power graph below (all measurements at 20KHz).
The LF spectra look different comparing with the HF spectra. The 10Hz signal harmonics are monotonically (and slowly) decreasing up to the 11th and beyond. However the THD is still well beyond 1ppm, proving that a good quality bipolar capacitor is a good solution for a power amp.
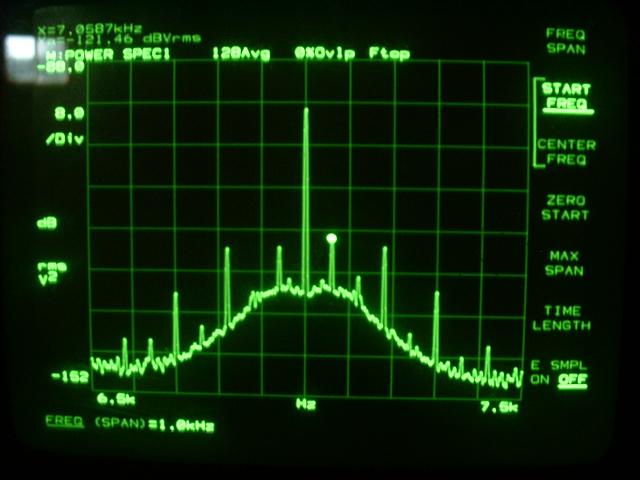
Next, we analyzed the IMD by the CCIF and SMPTE methods. For CCIF, 19KHz an 20KHz signals, originating in the PM5192 frequency synthesizer (19KHz) and the 3562A spectrum analyzer (20KHz) were mixed in 1:1 ratio. Both signal generators are 50ohm terminated, so the amplitude was chosen 2.4Vvv each to get 1.2Vvv for each component level. Unfortunately, the spectral purity of the signals is not very good, resulting in multiple artifacts. We tried to use the Amber 5500 sine wave generator for one of the components, however the output stage of the Amber 5500 was significantly distorting the other component. We also tried to use a AD797 ultra low noise/ultra low distortion opamp as a mixer. While indeed AD797 has very low noise and distortion, its contribution could not be neglected. Having to handle three contributions rather than two largely complicated the results processing, making an automated measurements approach almost impossible to implement. The 1:1 mixed signal (50ohm) is shown below.
We were unable to measure the IMD at the same 187W/4 ohm as the THD, but only at about 140W/4ohm. Reason is that at over 2.4Vvv output level, the distortion induced by the PM5192 synthesizer and the HP3562A output stages were largely masking the amp IMD.
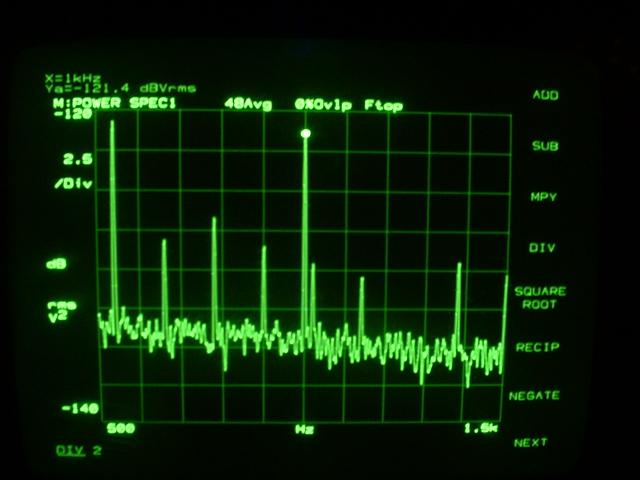
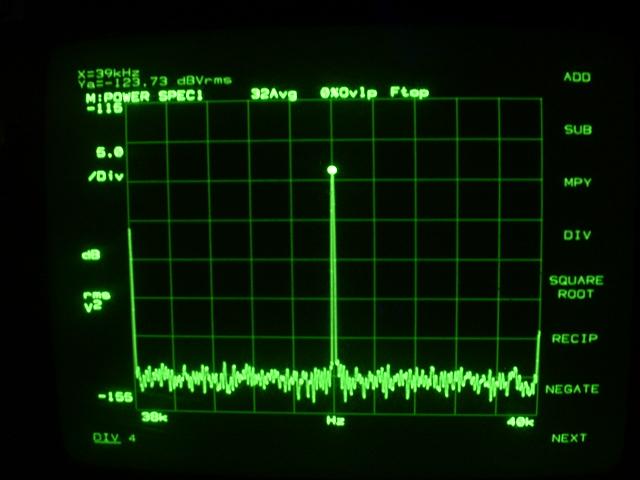
The 1KHz IMD product is shown below. It is well under 120dB which indicates that our target of under 0.0001% IMD was reached. The spikes around the 1KHz peak are 60Hz mains frequency odd harmonics (120Hz spaced) of unknown origin. They extend into the KHz range. The origin of these mains harmonics needs further investigations. At this point, we suspect a DC imbalance in the transformer core, or a magnetic field (radiated from the toroidal mains transformer) induction effect in the amp wiring.
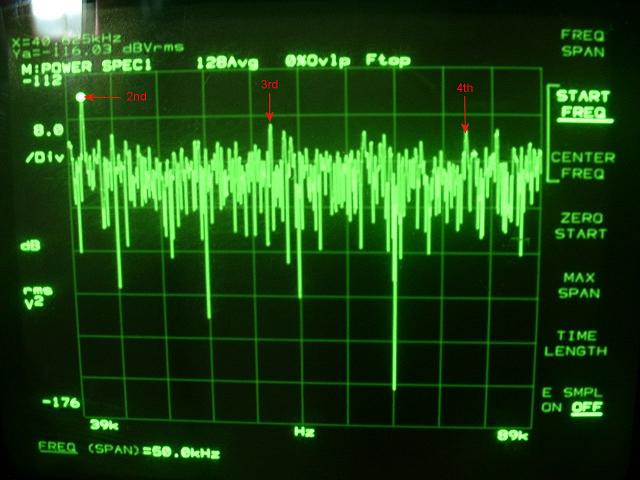
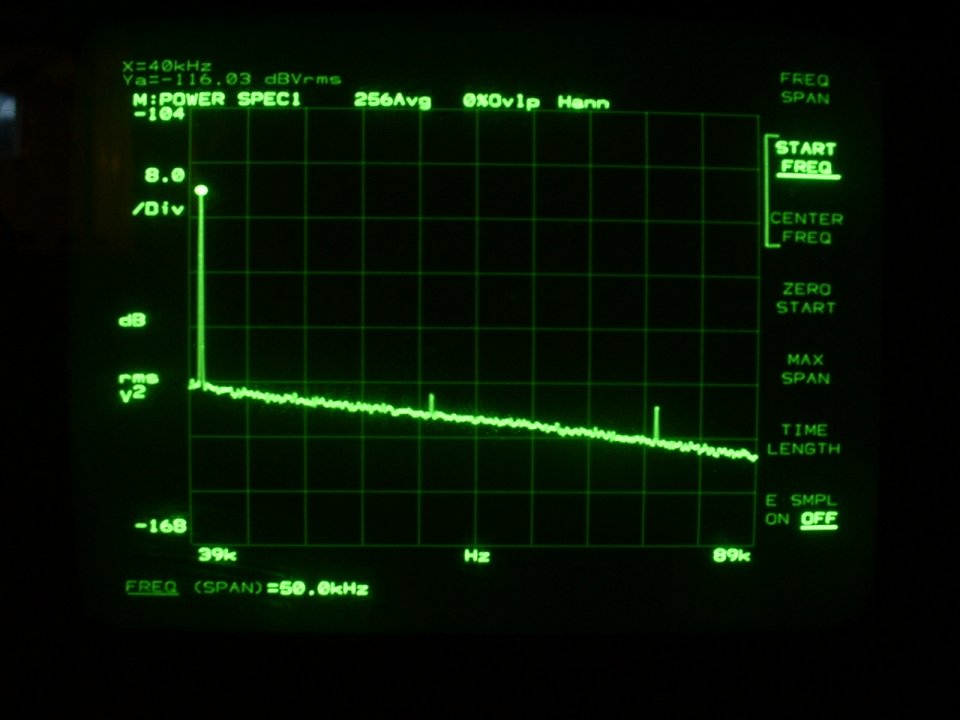
The 39KHz component is shown below. At this frequencies, the 60Hz harmonics are gone.
We also tried to use the SMPTE method to evaluate the IMD. 4:1 7KHz and 60Hz signals were mixed and applied to the amp input to get the maximum power before clipping of about 187V into 4 ohm. Unfortunately, only the Amber 5500 was able to supply a good enough high purity low frequency (60Hz) signal. Due to the reasons presented above (distortion in the Amber 5500 output stage) using an AD797 opamp mixer was unavoidable. We tried multiple opamps and only AD797, LM4562 and LT1115 were found appropriate in terms of noise and distortions.
We had great difficulties in measuring the output spectra, given the limited HP3562A dynamic range. The AD797 spectra was measured in a separate pass and substracted from the measurements using the HP3562A Math functions (spectra difference). In the picture below, Amber 5500 is set to as much as possible reject 7KHz, otherwise the dynamic range of our equipment would be exceeded.
Relatively poor 7KHz rejection is because of the two tone signals, confusing the Amber 5500 autotuning circuitry.
The above results are confirming with a high level of certitude that our amp reached the target of under 0.0001% (1ppm) IMD at full power. Unfortunately, we were unable to consistently measure the THD and IMD at low output levels. We need to further improve the measuring technique and the setup. One idea we are currently working on is to use a synthesized comb filter in the HP3562A to further filter the noise.
The Ultimate Audio Amp
From Genesis to Revelation
128 averages (synchronous measurements) were used. The measured results could further be cleaned by increasing the number of averages, however for the purpose of this work we found 128 averages as being a good compromise between accuracy and time required to complete a measurement cycle.
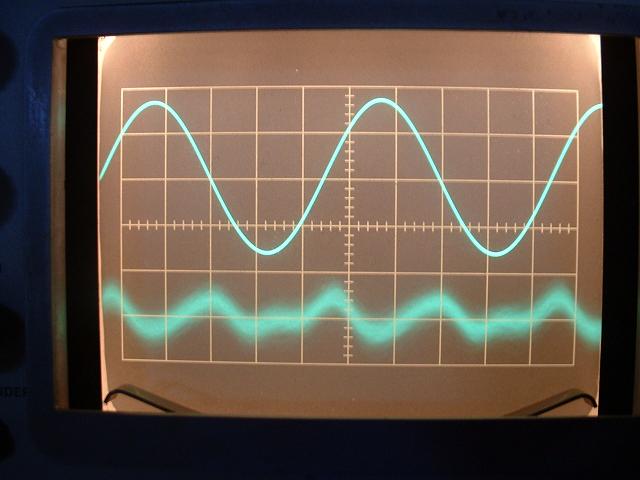
The picture below shows the result of THD+N measurement at 20KHz, using the Amber 5500 instrument, just before clipping (187W into 4ohm as in all the other results throughout this work, unless otherwise mentioned). The lower trace includes the Amber sine wave generator residuals. Vertical scale is in arbitrary units for both traces (the Amber 5500 instrument is on autoscaling). From the lower trace it is obvious (and this will be re-confirmed below) that our amp distortions are essentially 2nd harmonic. A third harmonic component exists (the small ridge) but its significant lower than the 2nd harmonic.
Although the average THD at 1W is slightly over 1ppm, we are quite happy with the overall results. Our amp beat the 0.0001% (1ppm) distortion barrier, at all frequencies and (almost) all output levels! The distortions are essentially 2nd harmonic, although a 3rd harmonic component is also contributing to the THD. All other harmonics can be neglected in a quantitative analysis.
Some concerns were expressed regarding the impact on the LF distortions of the DC blocking capacitor in the FB path. An opamp based servo has certain advantages but, even set aside the extra complexity, has some drawbacks as well. The impact of a good quality bipolar capacitor on the low frequency THD is shown in the following photo.